Fixing Mislabeled Data: Mapping Merged Sidewalk and Parcel Data in Detroit
Diving into Data Cleaning & Mapping Techniques
After mapping DDOT bus stop assets in Detroit, I revisited the sidewalk reporter data to see if there was a way to map it out too. I found that the web app had a parcel data layer that was separate from the reports itself. In looking at it closer, I found that the parcel layer was from 2018, but I figured that it would work for what I wanted to use it for.
My Code
Data Exploration and Cleaning 🧹
I started by pulling the data and (for sanity’s sake) cleaning it of columns I didn’t really want to have. Then after grabbing the sidewalk reports data as before, I merged the data together based on the common ‘address’ column and retained the rows from the sidewalk reporter. This helped reduce my data set so I don’t have all the unused parcels sitting around conflicting with what I wanted to look at.
Once I had my full dataset together, it was a good time to take a look at any reports that were missing latitude and longitude data points from the merge. I found two missing locations and manually added their coordinates using Google Maps.
Troubleshooting the Mapping Issue 🐞
When I got to mapping this out, I found that my updated points were the only two that appeared to be mapped. Which I thought was a bit odd until I zoomed out and found all my points getting placed in Antarctica, which was very strange. So I spent the better part of an hour 💀 mucking around with the map over several iterations and checking that I put in my data correctly to clear the missing locations. Going nowhere there, I figured I should look over my parcel data which is where I found my issue.
Even though the city’s map viewer accepts the layer and correctly maps it I couldn’t shake how the dataset had four columns instead of just two for separate latitude and longitude information. Closer inspection shows that their “lon” column was empty and their “lat” column showed what was in the “LONGITUDE” column 😲. Leading me to think I should flip their latitude and longitude columns and remap it.
It worked! For some reason the city’s parcel data had mislabeled their longitude and latitude columns and must’ve been doing something on the backend to get it to visualize instead of having a clean dataset (maybe using the “LAT_LONG” column) 🤷♂️ .
In summary, Here is what I did to clean the data 😤:
- Removed columns that I didn’t need or want from the parcel dataset and with the data merged, I dropped a duplicate CreationDate column and renamed the original from the reports dataset.
- Identified rows where there were missing latitude and longitude data and then added the missing data into the set.
- Flipped the data held in the LONGITUDE column with the data in the LATITUDE column.
Creating the Visualization 🌍
With all that cleared up, I built my map to show where each sidewalk report is located and colored (using the city’s brand guidelines again) by year with the oldest reports being dark colors and the newer reports being a blue or green. You can also select each year as a layer if you want to see any parts of the city reported on in a specific calendar year.
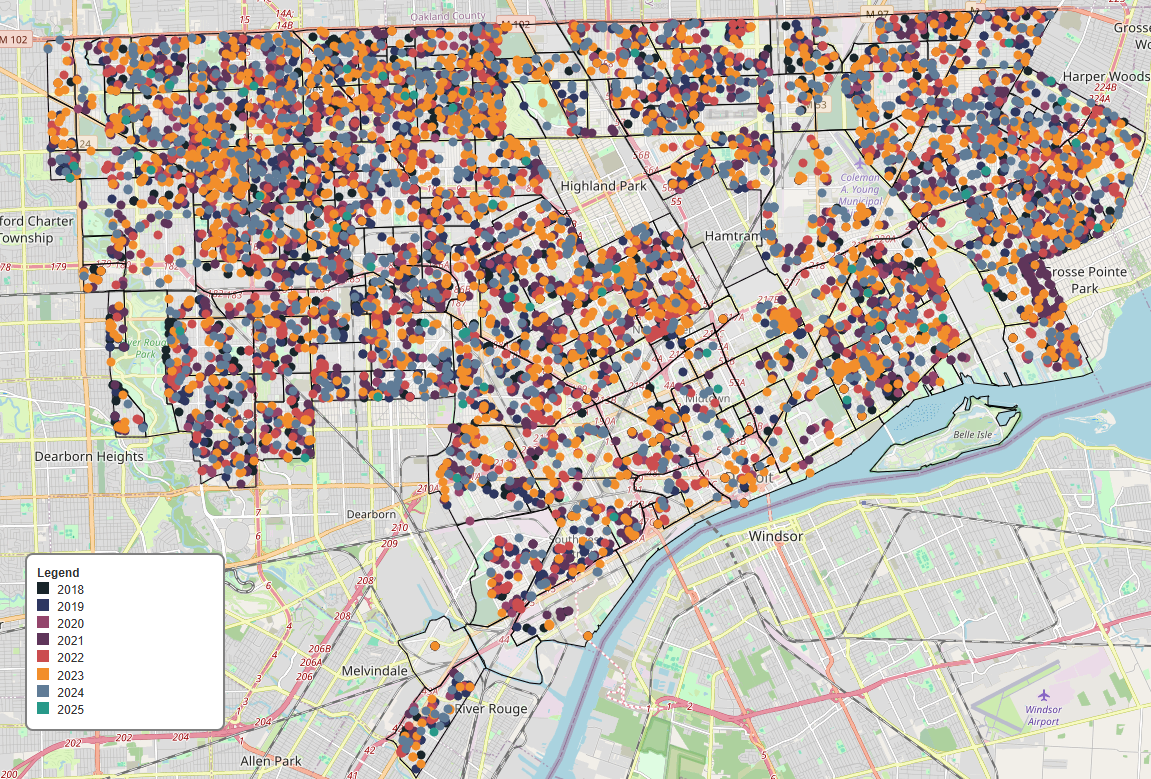 Created using the Folium Python package by converting longitude and latitude columns into a column of shapely Point objects and transformed into a GeoDataFrame.
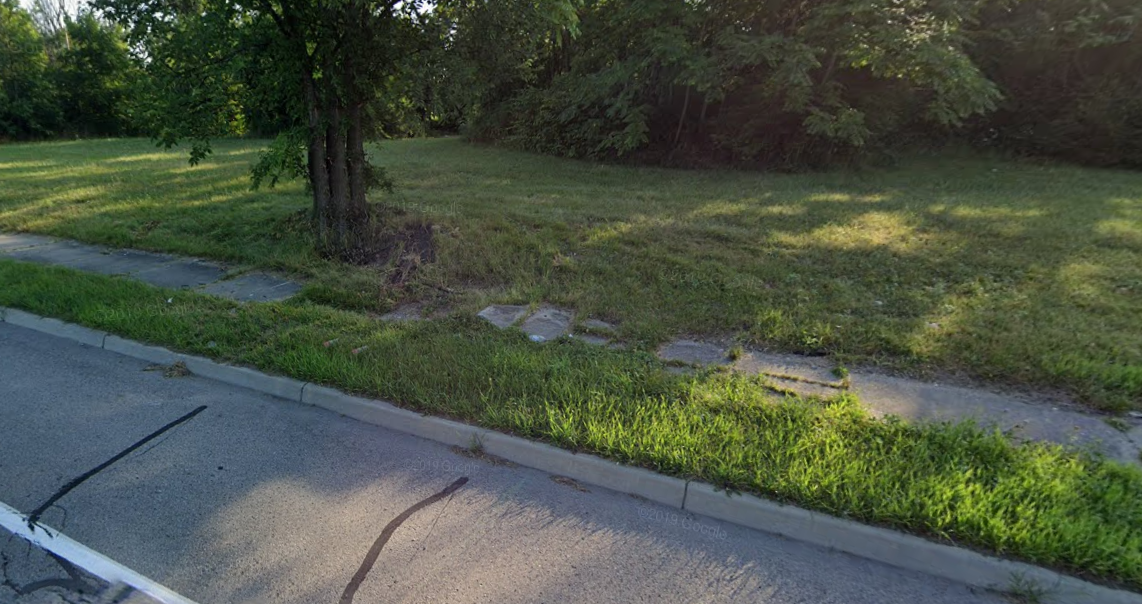
When I looked at each layer, I thought it was interesting that essentially the entirety of Chalmers Street between Jefferson and Mack Ave. was reported on in 2021. I looked at 1220 Chalmers and the same piece of sidewalk looks very much as broken in 2023 as it did in 2019. Take a look at reports in your area and let me know if an older reported sidewalk got fixed up!
|

|